Table of Contents
3D Pie Chart in Adobe Illustrator
In today’s tutorial, you will learn to create a 3D Pie Chart in Adobe Illustrator with the help of the Pie Graph Tool and the 3D effect.
To create a 3D pie chart with percentages in a circle, Launch Adobe Illustrator and create a new document. Now follow the below steps:
Step 1
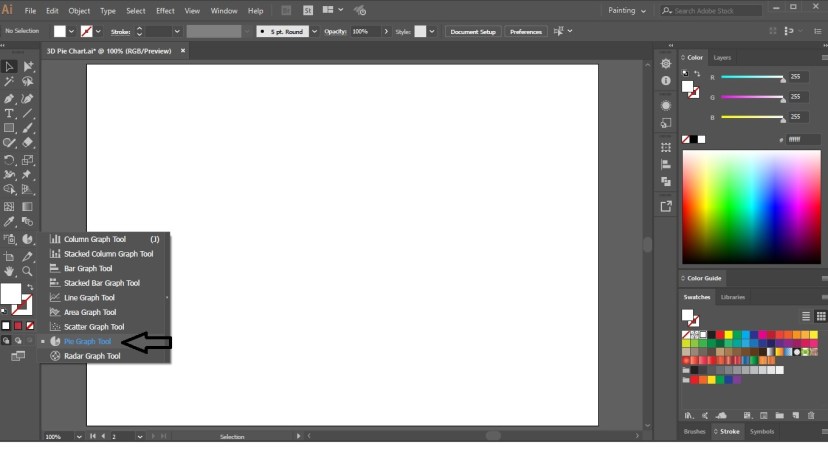
Click on the Column Graph Tool and select Pie Graph Tool.
Now, drag the cursor on the artboard with a click to draw the Pie Chart.
Step 2
Now, enter the values in the Graph Data Panel and click on Apply.
Now, select the Pie Chart and turn off the Stroke color.
Step 3
Select the Pie Chart and press Shift + Ctrl + G to Ungroup the selection.
Now, select all the segments and rotate the Pie Chart.
Step 4
Select one segment and click on Effect in the Menu Bar. Place the cursor on 3D and select Extrude and Bevel.
3D Extrude & Bevel Options dialogue box will appear on the artboard. In that dialogue box, set the position to Isometric Top and then manually rotate the selection. Then increase the Extrude Depth and then click OK.
Similarly, apply the 3D Extrude and Bevel Effect on other segments also.
Step 5
Now, fill the segments with Gradient and add detailing to your Pie Chart.
So this is how you can create a 3D Pie Chart in Adobe Illustrator.
Practice this tutorial and share your views in the comment section. Also, share this tutorial with others.


